
ream88
Weird memory leak issue
Hey everybody,
so I have a really weird memory leak problem: I have an app the calculates a schedule for a given month. To do that I have like 350+ users, which assign themselves free slots in predefined shifts. Basically there is a 1:n relation between shifts and slots, and a 1:1 between slots and users. As standard month therefore has ~50k slots to check and assign users to it, based on some application logic rules. Rules are just modules that follow a certain behaviour and return a score, the user with the highest score then “wins” the slot and is assigned to the shift. So far so good, I have unit tests for everything. Now the weird thing is, after the calculation is finished I always run into a weird memory leak, see the image below.
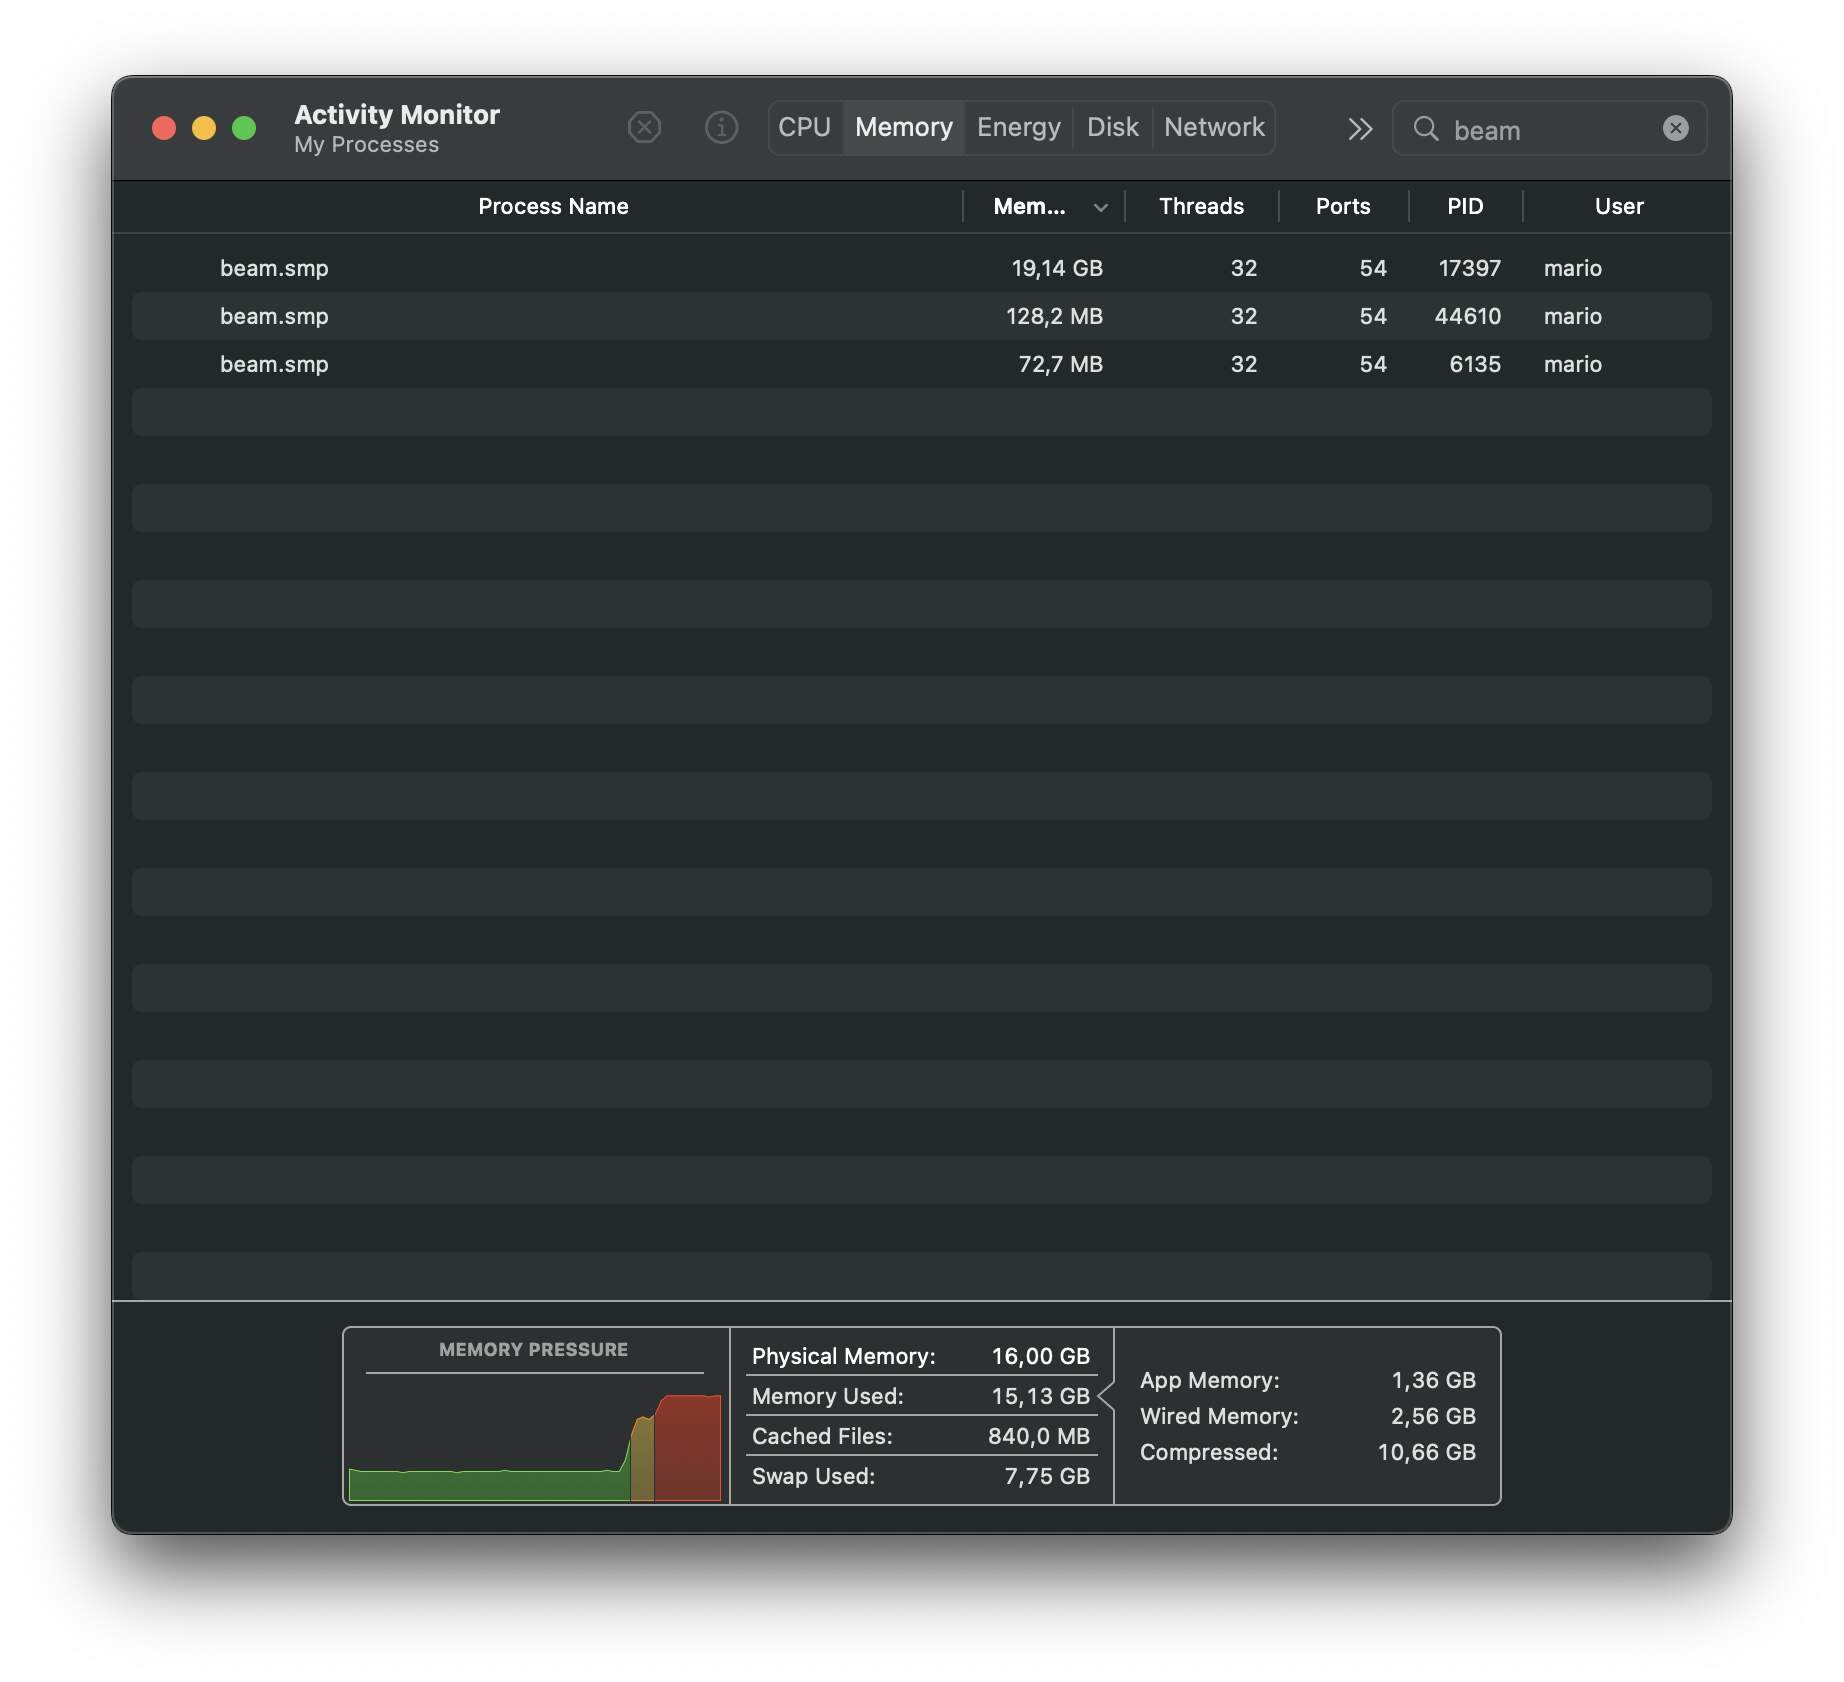
First this happened when starting a supervised Task from my LiveView which would take care of the calculation. Thanks to @hubertlepicki I was able to figure this problem out: Looks like copying a lot of Ecto records including associations from one process to another is not a very good idea.
Now I even get the memory leak in iex when I try to autocomplete like this: scheduler.sche... scheduler is a state struct of the Scheduler module which basically looks like this: defstruct schedule: [], rules: [], slots: [] Are 50k+ records in memory to much for beam to handle? Also why does the autocomplete crash, but accessing it without autocomplete does not. Could it be that autocomplete tries to copy the data to another process? And yes phx.server also crashes with the memory leak after the calculation, not sure where the copying happens there yet.
Marked As Solved

benwilson512
Yeah this means you have a giant value in a single variable. This doesn’t sound like a memory leak, this sounds like you’re somehow putting tons of data into a single value.
Also Liked

al2o3cr
If the associations that you’re preloading involve the same records more than once, you might encounter headaches due to loss of sharing. There’s a good discussion in the BEAM efficiency guide with some examples of getting the byte-size of various terms.
An example of what I’m thinking of in the standard posts/comments/authors pattern would look like:
Repo.all(Post) |> Repo.preload(comments: [author: :posts])
Here, there are going to be a LOT more resulting Post structs than rows in the Post table since every comment has a new set of the author’s posts.
In some ORMs in languages with mutable data this can be made efficient with an identity map, resulting in a cyclic graph of objects - but that shape is not available in Elixir.
benwilson512
I mean that there is a bug in your code where you’re loading more data than you intend to. There’s no way 50k records, even with preloads, should be taking 19gb. There’s gotta be a bug.
al2o3cr
Unless those records are QUITE substantial (19GB memory / 50k records = 380 kilobytes apiece) this doesn’t seem like the whole story.
benwilson512
:erts_debug.size/1 will emit the size of a variable in words.
Without seeing your code it’s a bit hard to guess at things like this. I would turn on debug ecto logging and make sure that you aren’t seeing unexpected querying.

Exadra37
If your problem is the Ecto preload, and not an huge dataset in one variable, then you may want to see if the official docs on preload queries can help:
https://hexdocs.pm/ecto/Ecto.Query.html#preload/3-preload-queries
Sourced from this Stackoverflow question:
Another resource I found on preload is this talk:
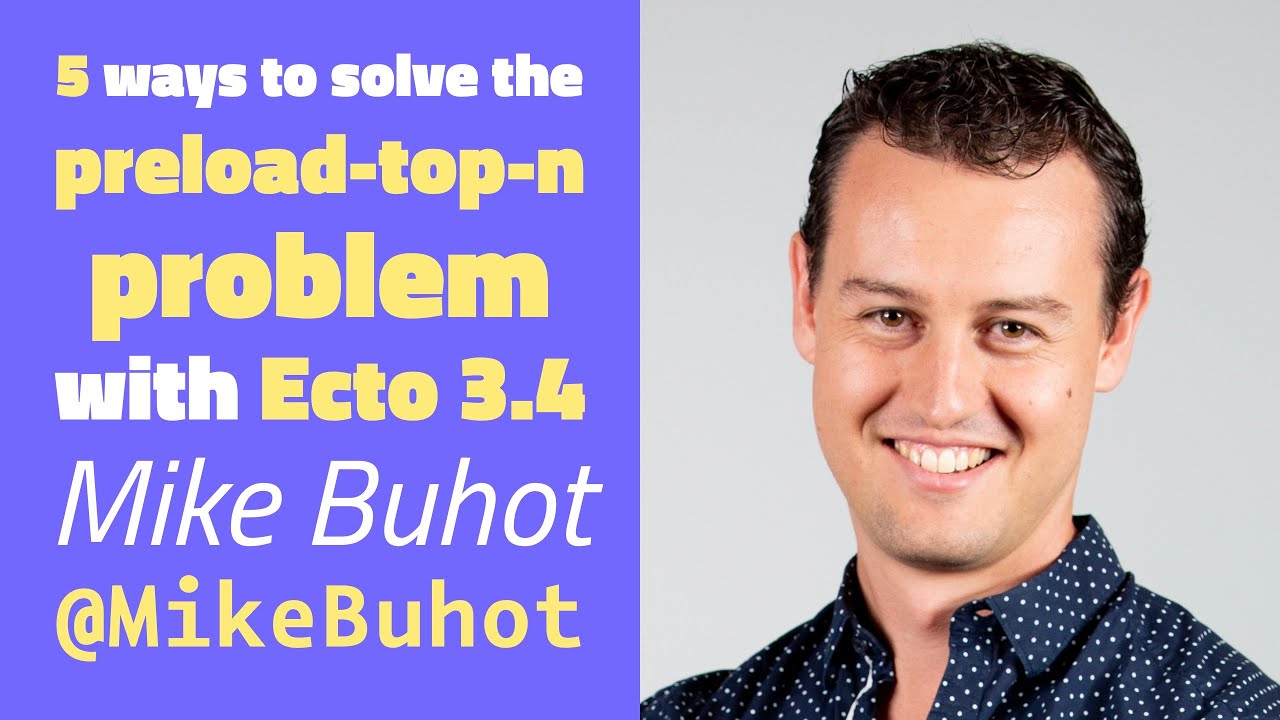
In the past Ecto preload had issues with memory as per this issue:
Popular in Questions








Other popular topics







 Latest Phoenix Threads
Latest on Elixir Forum
Sponsor Spotlight

Producing high quality Elixir screencasts since 2017.
Categories:
Sub Categories:
Forums
Our Sponsors

Build Elixir applications with speed and confidence.

Supporting innovation across the BEAM ecosystem.

We build reliable cloud platforms for business-critical systems.

Catch errors, track performance, monitor hosts and more.

Develop your skills with books, videos, and courses.
Producing high quality Elixir screencasts since 2017.

The deployment platform built for Elixir: PaaS ease, VPS control.

Courses that'll move you from confusion to "Aha, now I get it!"